
What evidence-based practice is and how it might be applied within an organization.
Evidence-based practice (EBP) is an approach to decision making that health workers apply combining the best available research evidence, clinical expertise, and patient preferences to inform patient care decisions (Schmidt & Brown, 2024).
EBP can be applied to various aspects of an organization from operations to decision making processes(Schmidt & Brown, 2024). One is in the creation of Human Resource (HR) policies and practices. EBP can be used as a tool to find the best practices that are backed up by research in many different areas such as recruitment, orientation, performance appraisal, and employee development when organizations are establishing or changing HR policies. This will allow policies to be based off of the most current research, and therefore, will be most likely to work. Second, in training and development, EBP can be used to select and implement training programs that have been tested through research and are known to achieve the desired results.
Third, in performance management, EBP can help formulate systems that are fair, equitable, and in line with the organization’s goals. This allows companies to easily identify and correct performance issues before they get out of hand, and also provides the employee with the necessary means to improve their performance. Fourth, EBP can assist in the decision making process on numerous organizational matters such as personnel issues, allocation of resources, budgets, and strategic planning. It enhances organizational decision making for the attainment of goals.
In summary, EBP can assist practitioners in making smart and successful organizational choices, performing more efficiently, and achieving more favorable results.
Importance of using data in organizations and necessity to ensure data accuracy
Data is the lifeblood of modern organizations. It gives the required information for decision making, market trends, and the most efficient operational practices. Various reasons exist to support this assertion.
Data allows companies to make educated decisions that are grounded in data-driven theories (Ranjan & Foropon, 2021). Leaders can look at data, and find opportunities, risks, and make strategic decisions that best suit their goals. This is critical for problem solving because data is essential for identifying and addressing problems. All they have to do is look at the data and they can tell what the real problems are, what patterns are emerging, and whether or not the solutions are effective. That then trickles down into process improvement in that the data allows for the processes and procedures to be streamlined. It is through the detection of these bottlenecks and inefficiencies that organizations can smooth operations, cut costs, and increase productivity. Not to mention that data also yields customer insights and allows companies to know their customers more. From the analysis of customer data, a company can design products and services to fit the individual’s needs, ensuring customer satisfaction and ultimately loyalty. On a macro-scale, data is crucial for risk management because information is useful in pinpointing risks and lessening their impact.
On data accuracy, any analysis or decision is only as good as the data upon which it is predicated. Inaccurate data leads to false knowledge, false conclusions, and costly mistakes. Precise data yields reliable Insights which in turn lead to meaningful objectives and goals. False information will skew the trends, hide the patterns, and make it impossible to see any meaning in the conclusions. In addition, reliable information is essential in gaining the trust and confidence of shareholders. Organizations can make fact based strategies when they have the trust of all their stakeholders. Precise data is also the basis for legal and ethical compliance and many industries have laws that regulate how accurate their data must be.
Organizations must therefore have strong data governance in place to include data quality checks, data validation procedures, and data cleansing processes to guarantee that the data is correct.
Different types of data measurements used by people professionals
People metrics are used by “people professionals” to examine and analyze human capital. These metrics usually fall under two main categories i.e. Quantitative Data and Qualitative Data (Garcia-Arroyo & Osca, 2021).
Quantitative Data is the numerical measurements or any information that can be subjected to statistical analysis, for example, demographics (sex, age, race, education level), compensation (salary, bonuses, benefits), absenteeism (number of absences and duration of each absence), performance (ratings, productivity), tenure (length of employment), turnover (rate of turnover), and training and development (percentage of employees that have gone through programs. Qualitative Data on the other hand is the opposite, meaning that it comes from non-numerical, non-measurable data that can’t be analyzed statistically. Some methods for qualitative data to collection include employee surveys, focus groups, individual interviews, observations, and case studies.
People professionals analyze this information using different statistical methods. Descriptive statistics are used to summarize and describe data and inferential statistics help to find relationships among data and to draw conclusions about a population based on a sample. Predictive analytics on the other hand helps forecast future trends and outcomes while and prescriptive analytics recommend specific actions based on the analyzed data.
So by using all of these various approaches, people professional can learn a lot about their labor force. This data can also be provided to HR so that they can base their policies and procedures off of the data, and be more effective and data driven in their decision making processes.
How application of agreed policies and procedures informs decisions
EBP uses policies and protocols in making decisions. They guarantee that certain standards are met, ethical issues are covered, and full legal compliance. Policies and procedures first of all offer a “structure” to practice, insuring that decisions made are in accordance with the organizations values, mission, and goals (Bullock et al, 2021). Secondly, they provide a format for making decisions and therefore eliminates the possibility of forgetting something or making a mistake. Following these policies allows for consistency in decision making, and less variability means better outcomes.
Policies and procedures also usually cover ethical issues and legal necessities, protecting the rights of the people involved. They are also a standard for those who must decide, to help them balance the scales, to make a decision with full knowledge. Lastly, policies and procedures make it easy to track performance, to find where the problems lie, and to place responsibility of certain actions on certain individuals.
However, policies and procedures are only the structure and they cannot be too inflexible. Policies and procedures need to be periodically reviewed and updated to be sure they continue to be relevant and useful. Furthermore, adherence to these policies and procedures is crucial for maintaining credibility and avoiding legal issues. Organizations can make better decisions, produce better results, and create an atmosphere of accountability and professionalism by simply adhering to established policies and procedures.
How people professionals create value for people, organizations and stakeholders.
Human resource professionals are instrumental in creating value for the individual, the organization, and broader stakeholders.
For people, HR is there to make sure employees are taken care of, by providing a pleasant working atmosphere, support programs, and by enforcing health and safety requirements (Dang et al, 2021). They also promote career growth with training, mentoring, and room for upward movement. They also help their employees maintain a healthy work-life balance by allowing flexible work schedules and work-life integration. Whether it is through the recognition and rewards of employee achievements or the promotion of diversity and inclusion, all of these factors serve to enhance employee morale.
In organizations HR professionals are in charge of bringing in and hiring the best people, the people that have the skills and knowledge that the organization needs to succeed. They create an environment where employees are engaged which in turn makes them more productive, less likely to leave, and provides better customer service. They also assist in establishing and upholding a healthy organizational culture that supports the beliefs and objectives of the organization.
For more general stakeholders, HR people also participate in community outreach via corporate social responsibility projects and employee volunteering. They see to it that the firm follows all ethical business policies and that they do not hurt the environment and that they practice sustainability. They also control the image of the organization by maintaining good relations with employees, customers, and other interested parties. And through the use of best practices and innovations, HR can make the organization a leader in the industry. They also help with the economy, they create jobs, and they support local businesses.
How to Be Customer-Focused and Standards-Driven
To be user oriented I should be able to evaluate what the user needs and answer in a relevant, informative, and helpful way. That means really listening to their questions, what are they asking me, and answering their question in the way they are asking the question (Kelso, 2022). The more I learn from user feedback and interactions, the better I can do my job of serving their needs.
To be standards driven, I have to follow some sort of predefined guidelines and standards relating to the business processes and the products or services I am offering. This ensures that my responses are accurate, unbiased, and appropriate. I also need to look up some facts from reliable sources so that I don’t give false information. Ethical concerns are also important; I can’t produce anything that takes advantage of the consumer.
Analyzing and Visualizing Turnover Rates
Percentage the number of employees leaving each department, each year
[wpdatatable id=15]
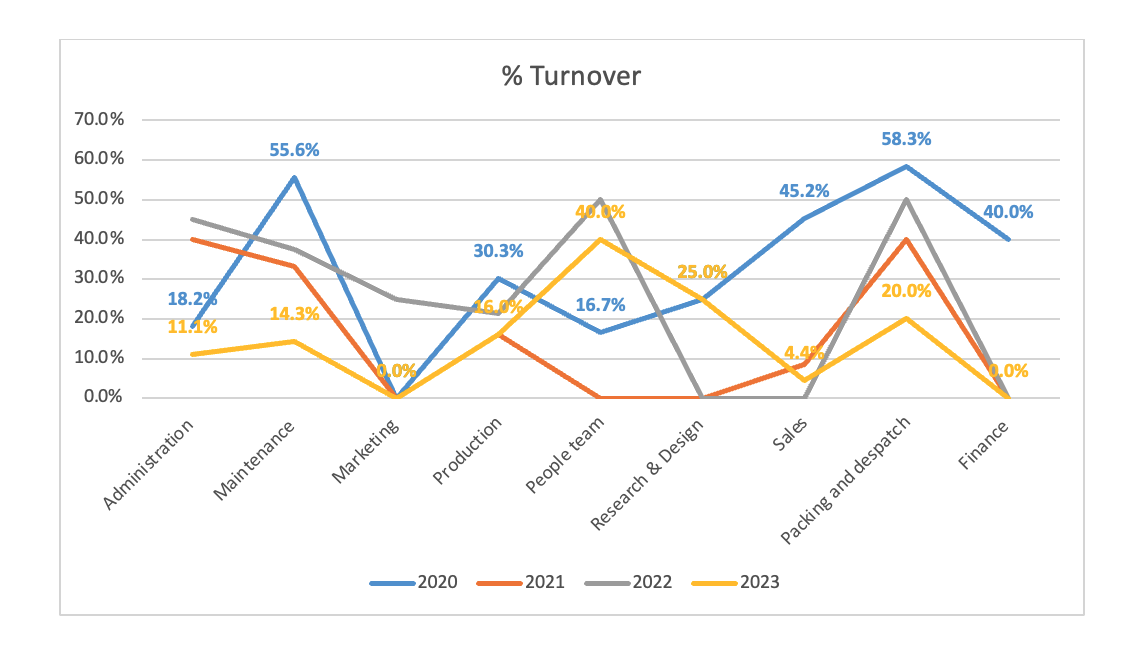
The overall organizational turnover rate has decreased from 34.3% in 2020 to 14.2% in 2023. However, turnover rates varied significantly across different departments. Some departments, such as Maintenance, experienced high turnover in 2020 but saw significant improvements in subsequent years. In contrast, departments like Marketing and Finance consistently maintained low turnover rates throughout the three-year period.
Diagrammatic Representations
- Bar Chart:

A line chart illustrating the trend of turnover rates over time for each department. The x-axis represents the department, the y-axis represents the turnover percentage, and different lines can represent each year.
- Line Chart:
Potential Issues and Solutions
High Turnover in Certain Departments:
And, to keep certain high turn over departments, the cause of the turn over must be pinpointed. Exit interviews and employee surveys can help determine why people are leaving the company. When these causes are identified, then specific remedies can be applied. For instance, if money is a key issue, the company could look into raising salaries, or providing better benefits. And if work and life balanced isn’t there then flexible work schedule or more vacation time. Additionally, investing in training and development opportunities can help employees feel valued and motivated.
Fluctuating Turnover Rates: Turnover rates would be a good example, but they would fluxuate due to outside factors like the state of the economy or the trends of the industry. So it is necessary to take a look at these outside factors to see how they effect turnover among employees. After these factors are determined, then the HR strategies can be altered to meet the unique problems and possibilities of this changing environment.
Consistent Low Turnover: And those departments that never have a high turnover should be rewarded, so that they continue to do that. If the organization recognizes and rewards these departments, then maybe other departments will follow suit. Also, studying the procedures, the reasons why these departments have such low turnover rates, can give us some ideas to use in other departments. If the organization can figure out what these best practices are and implement them, it could retain its employees better, and be a better performing organization.
Through the use of these graphical formats and close examination of the data, the people practice team is able to see turnover trends, recognize possible problems, and take specific measures to retain employees and enhance the organizations performance as a whole.
References
Bullock, H. L., Lavis, J. N., Wilson, M. G., Mulvale, G., & Miatello, A. (2021). Understanding the implementation of evidence-informed policies and practices from a policy perspective: a critical interpretive synthesis. Implementation Science, 16, 1-24.

Dang, D., Dearholt, S. L., Bissett, K., Ascenzi, J., & Whalen, M. (2021). Johns Hopkins evidence-based practice for nurses and healthcare professionals: Model and guidelines. Sigma Theta Tau.

Dang, D., Dearholt, S. L., Bissett, K., Ascenzi, J., & Whalen, M. (2021). Johns Hopkins evidence-based practice for nurses and healthcare professionals: Model and guidelines. Sigma Theta Tau.

Garcia-Arroyo, J., & Osca, A. (2021). Big data contributions to human resource management: a systematic review. The International Journal of Human Resource Management, 32(20), 4337-4362.

Kelso, F. J. (2022). Exploring Employers’ Practices when Approving or Denying Reasonable Accommodation Requests in Federal Executive Departments (Doctoral dissertation, Cambridge College).

Ranjan, J., & Foropon, C. (2021). Big data analytics in building the competitive intelligence of organizations. International Journal of Information Management, 56, 102231.

Schmidt, N. A., & Brown, J. M. (2024). Evidence-based practice for nurses: Appraisal and application of research. Jones & Bartlett Learning.