People professionals at Company X can use various types of including both qualitative and quantitative types, to make data-driven decisions in their EBP.
Qualitative data is descriptive, non-numerical and non- measurable data that provides insights into employee satisfaction levels and opinions. People professionals collect qualitative data using surveys that have open-ended questions, individual interviews and focus group discussions (Bergin, 2018). For instance, Company X can analyse written feedback from a survey (the most common responses from several respondents) to uncover the underlying reasons for trends such as a high employee turnover rate in a specific department.
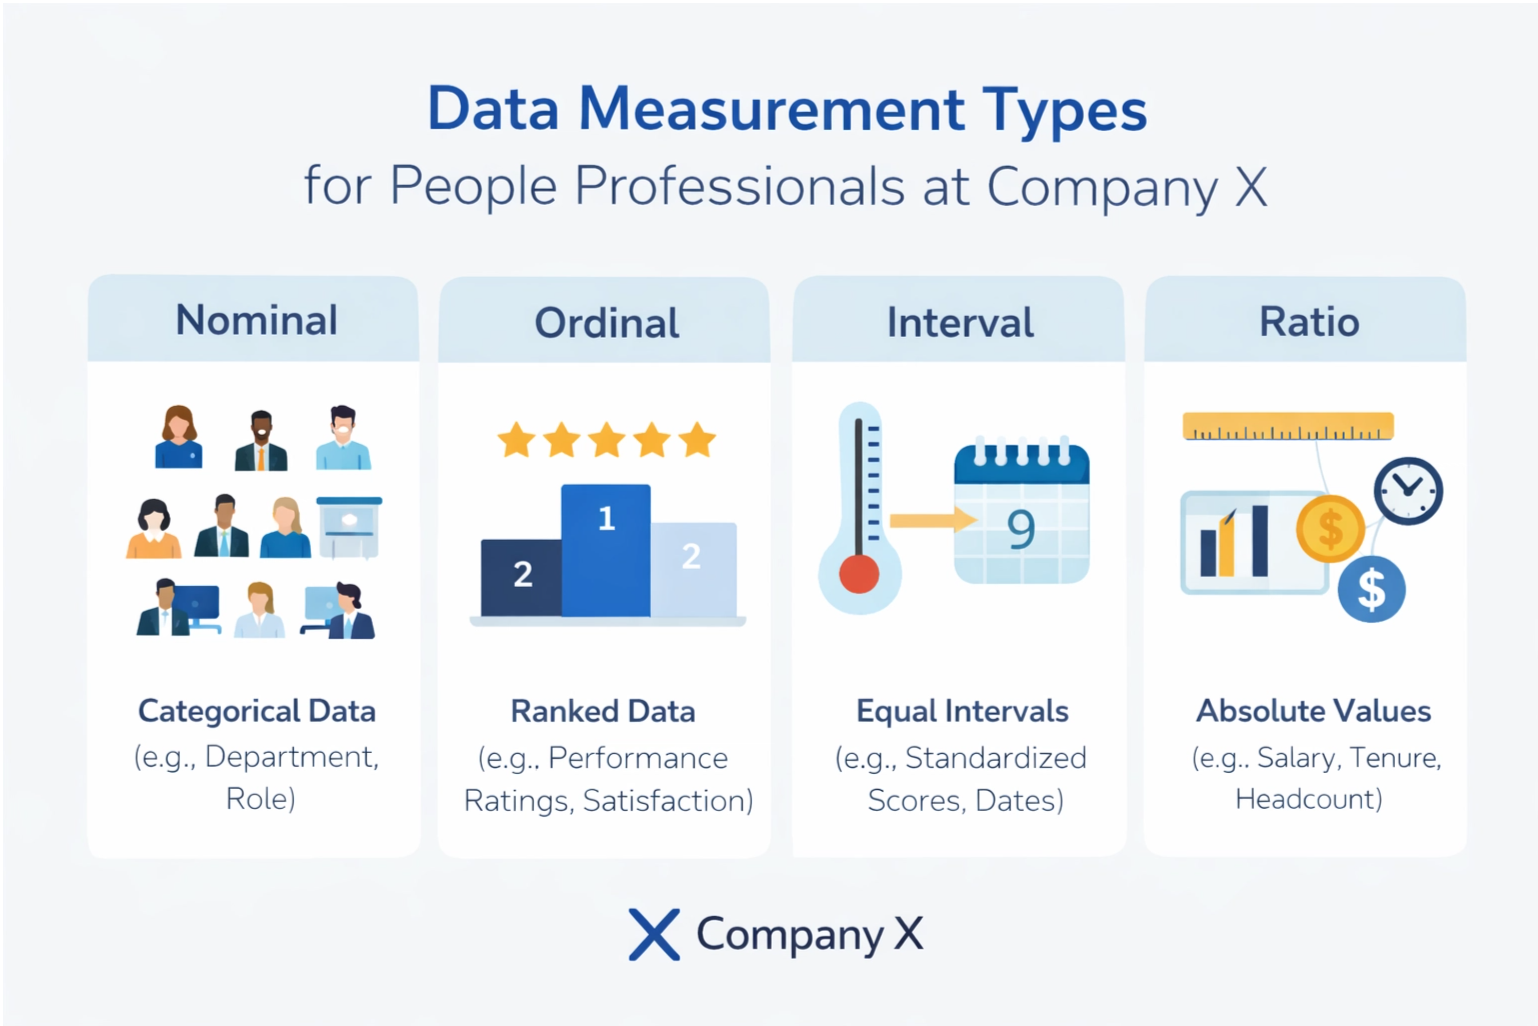
On the other hand, quantitative is measurable and numerical, which makes it statistically analysable (Bergin, 2018). Quantitative data consists of four types i.e. nominal, ordinal, interval and ratio data. Nominal data groups information without specific numerical orders, e.g. types job roles or departments, etc. This approach is useful in counting frequencies, like the number of employees in each team. Ordinal data groups information using a logical rank, like ratings from on a Likert scale in a survey e.g., dissatisfied/satisfied, agree/disagree, etc which helps gauge the intensity of a sentiment. Interval data groups information using at equal distances between values but lacks a true zero point, while ratio data has a true zero, allowing for meaningful calculations and comparisons. Common metrics such as Likert scale ratings of employee satisfaction from 1 to 5 or Employee survey scores are all examples of interval data while absenteeism rates, time-to-hire, and cost-per-hire are all examples of ratio data
Company X can skilfully combine these different data measurements and move beyond simple descriptions to undertake comprehensive analysis that provides clients with detailed and tailored sound insights to improve people practices.